When are $159,776, $200,000, and $250,350 all equal? When you’re talking about housing over time.
A recent RECON article discussed the disappearance of new homes selling for less than $200,000 in Texas. In the article, I mentioned inflation played a role in the reduction of affordable homes.
Let’s talk about that.
As we’ve learned the last couple of years, $200,000 isn’t what it used to be. But it can be even more complicated than that.
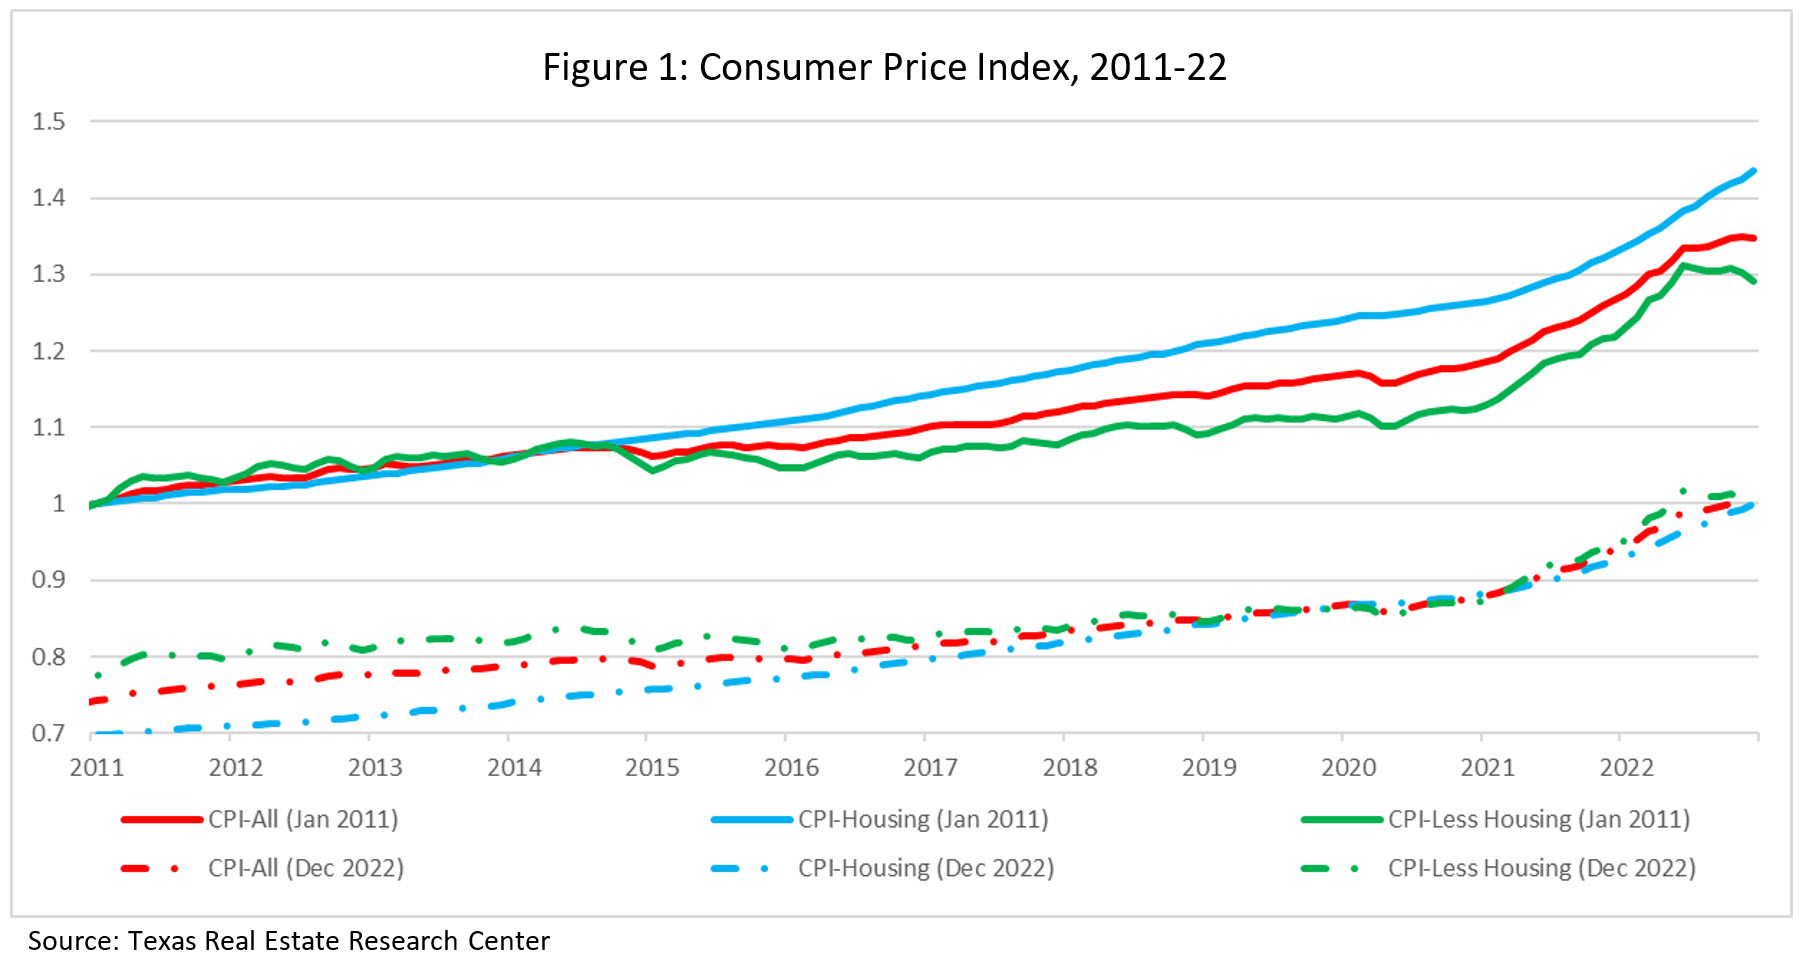
Look at Figure 1 and notice how the Consumer Price Index (CPI) has changed over the past 11 years. The dotted lines convert today’s dollars to 2011 values, while the solid lines convert the past values to 2022 dollars.

According to the figure, the average price of goods and services was around 35 percent higher in 2022 than it was in 2011 (based on the broadest CPI measure, shown as solid red line.) Alternatively, prices in 2011 were only 75 percent as high as they were last year.
The figure also shows home prices (solid blue line) increased more rapidly than all other goods and services (solid green line). Since housing makes up a large portion of the CPI basket, just doing standard CPI adjustments does not tell the whole story. What follows will track housing prices relative to the prices of all other goods.
If you have $200,000 in 2022 dollars, the amount of other goods and services (excluding housing) you could buy would have cost $159,776 in 2011 dollars. Inversely, $200,000 in 2011 dollars would have bought other goods and services worth $250,350 in 2022 dollars.
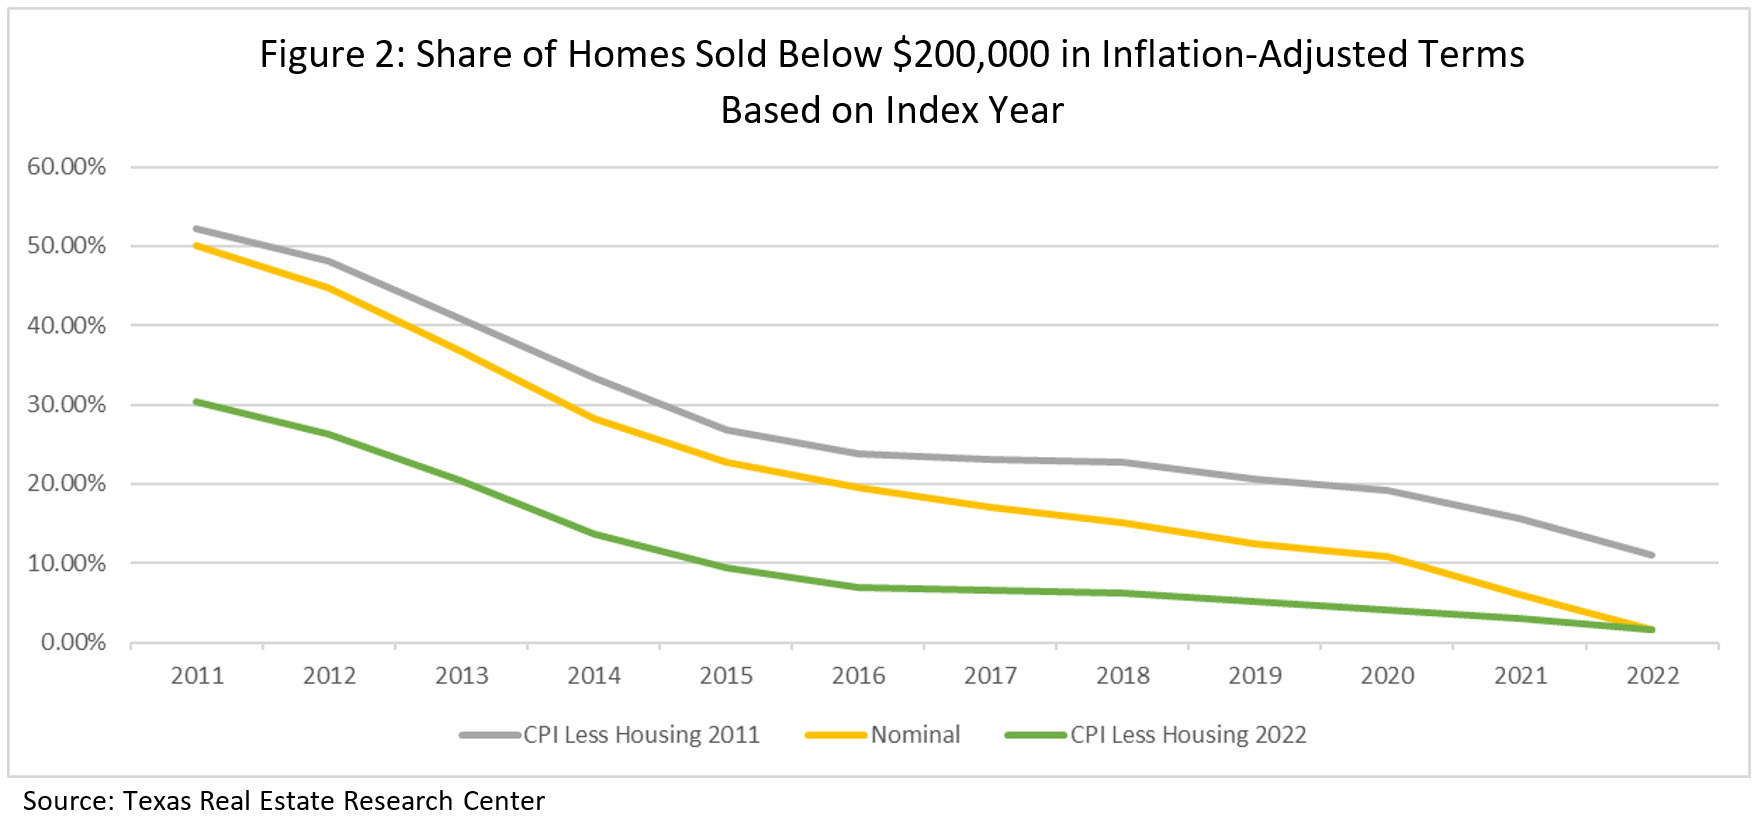
Making these adjustments hasn’t really changed the underlying trend, just the scale, as seen in Figure 2.

The share of homes sold below $200,000 in inflation adjusted terms differs depending on which measure of inflation is used. In 2011, roughly 60 percent as many new homes sold for under $200,000 in 2022 dollars ($159,776 in 2011 dollars). In 2022, there were seven times more new homes sold for under $200,000 in 2011 dollars ($250,350 in 2022).
