Editor’s note: This post is part of a new series about the impacts natural disasters have on a region’s public health, economic activity, and individual decision-making. While the papers cited in the posts extend beyond natural disasters in Texas, the results will be contextualized to the state’s population. For more about this series, click here.
The second paper of this blog series, “Let The Rich Be Flooded: The Distribution of Financial Aid and Distress After Hurricane Harvey,” was recently published in the Journal of Financial Economics by a team of researchers from the Federal Reserve Bank of St. Louis and the Leeds School of Business at the University of Colorado Boulder. Billings et al. (2022) study how flood damage affected Houstonians’ financial health, and they test for differential effects across various subpopulations. They use quarterly credit information for a panel of 108,707 individuals distributed across more than 32,000 census blocks in the Houston MSA.
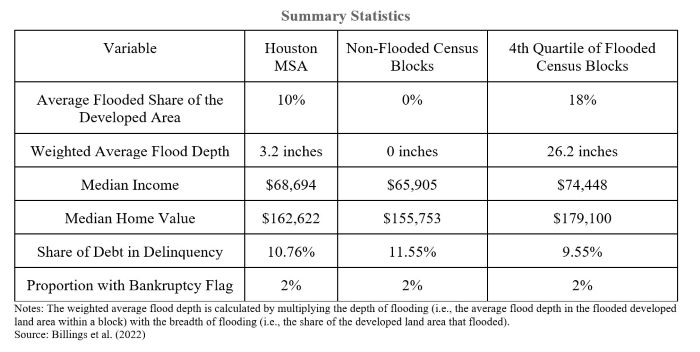
The combination of geospatial and financial data produces several interesting summary statistics (see table). Hurricane Harvey flooded an average of 10 percent of the developed land within each census block, and the flood depth (weighted by the portion of the census block that flooded) averaged more than three inches across the region. Flooding impacted a wide range of socioeconomic groups, and the most-flooded census blocks had slightly higher median home values and incomes relative to Houston’s census-block average. Note that the positive correlation of flooding and socioeconomic status across census blocks does not imply a similar relationship within census blocks.

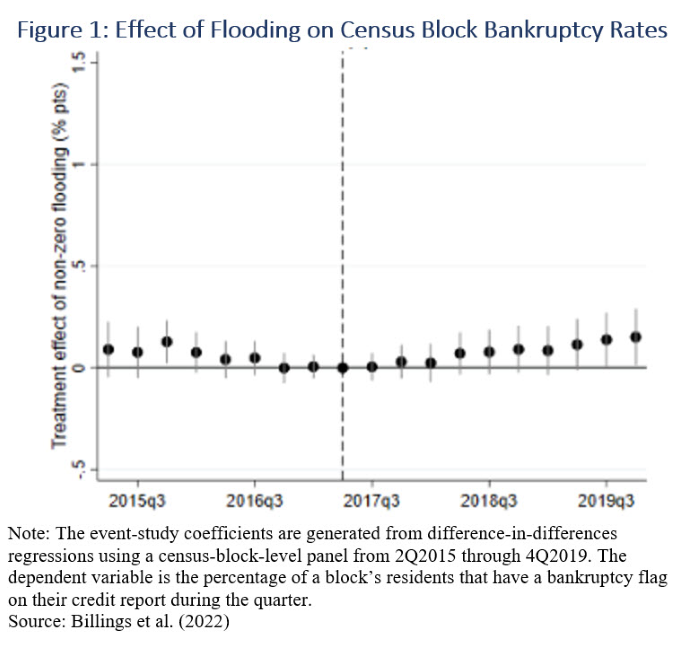
The authors’ empirical analysis is motivated by the consensus in the natural disaster literature (i.e., the average net financial impact of disasters is modest and short-lived). Using a treatment-intensity difference-in-differences design, they test this theory by comparing the evolution of financial outcomes for individuals who lived in non-flooded census blocks with those who lived in blocks with varying levels of flooding. The initial estimates suggest no meaningful increase in bankruptcy rates for flood-exposed individuals (Figure 1), a result consistent with the literature but still surprising given the average $200,000 of repair and renovation costs to Harvey-damaged homes.

A pattern of flood-induced bankruptcy emerges, however, when restricting the sample to certain subpopulations. Quarterly bankruptcy rates trend upward about a year after the storm for people living in flooded census blocks with an above-median share of owner-occupied housing (Figure 2). Bankruptcy may be a less relevant measurement of financial distress for renter households because, on average, they have fewer exempt assets that may be protected through a bankruptcy process (e.g., equity in their principal residence).
The bankruptcy pattern disappears when further conditioning on people who live in census blocks where the majority of developed land lies in the 100-year floodplain, areas that may have been protected through presumably higher flood-insurance participation (Figure 2A). Less than 10 percent of their sample, however, lives in those floodplain census blocks.
The impact of flooding on bankruptcy rates becomes even more apparent when restricting the sample to census blocks that have an above-median share of residents with low “ability-to-repay” (Figure 2B), a metric the authors calculate based on Equifax Risk scores and census-block median income. The point estimates peak around 0.7 percentage points, representing a 20 percent increase in mean bankruptcy rate for people in these same areas before Hurricane Harvey.

Billings et al. corroborate these concentrated effects when analyzing individuals’ proportion of debt that is at least 90 days delinquent (Figure 3). Delinquency immediately increases for below-median ability-to-repay individuals, but only for those living outside the floodplain.

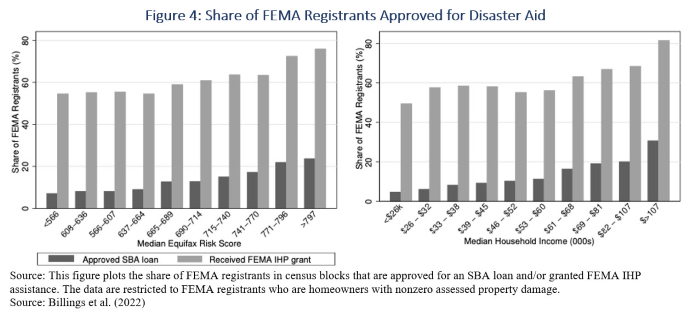
Both the bankruptcy and the delinquency results reveal significant financial distress that may be masked in the aggregate. While the average Houstonian’s balance sheet may have held firm, Hurricane Harvey caused significant financial distress for likely homeowners outside the 100-year floodplain who had lower baseline levels of financial health as measured by their “ability-to-repay.” This metric is a critical component in qualifying for the Small Business Administration’s (SBA) disaster loans, which often offer highly attractive terms (e.g., a 1.75 percent interest rate with up to 30 years to repay). Billings et al. illustrate the positive relationship between SBA-loan approval rates of FEMA registrants and financial health (Figure 4). This pattern is mechanical in the sense that stringent lending standards are designed to achieve the SBA’s goal of limiting taxpayer subsidy while offering aid.

The positive correlation between financial health and approval for FEMA’s Individuals and Households Program (IHP), however, is unexpected given that IHP-grant eligibility is based exclusively on uninsured damages less other forms of assistance, rather than on an individual’s ability to repay and factors like credit score.
Billings et al. find that this positive relationship holds even after controlling for flood insurance status, degree of property damage, and a multitude of other covariates. They estimate that individuals in low ability-to-repay census blocks are 12.3 percent less likely to receive FEMA assistance than their observably equivalent peers. The regressive allocation of these primary disaster assistance programs provides a potential explanation for the differential damage caused by Hurricane Harvey. Moreover, the aid distribution suggests federal disaster assistance serves more as a reinvestment stimulus than a social safety net.
